End point detection in tiration
All methods of the end point detection are based on the visible changes of the solution properties. The most obvious selection can be change in solution color, but also rapid changes in solutions turbidity are easy to spot.
Color changes are not instant. Reasons behind this behavior are described and discussed in the acid-base titration end point indicators. For now it is enough that you remember a rule of thumb, that for full color change property of the solution that is responsible for the indicator color must change by about 2 units. It can be 2 pH units for acid-base titration, or 2 pMe units for compexometric titration, or equivalent change of 120mV/n for potentiometric titration.
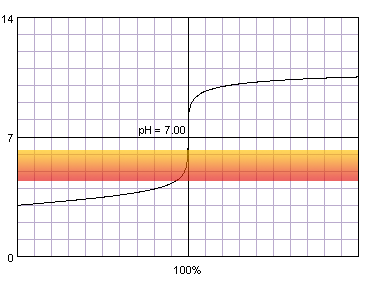
Let's take a look at the titration curve of 0.1 M strong monoprotic acid titrated with 0.1 M strong monoprotic base in the presence of the methyl red indicator. Methyl red changes its color between pH 4.4 and 6.2. This change is shown on the plot.
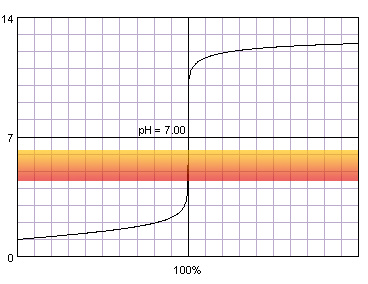
0.1 M strong monoprotic acid titrated with 0.1 M strong monoprotic base in the presence of the methyl red indicator. Note that while only color change area is marked on the plot, solution is red for lower pH and orange for higher pH. Titration curve calculated with BATE - pH calculator.
During titration, when we start to observe color changes, we are already on the steep part of the curve, very close to its inflection point. (Note, that methyl red is distinct from the methyl orange, you may see both used in popular titrations. Methyl orange starts to change color at pH 3.1.)
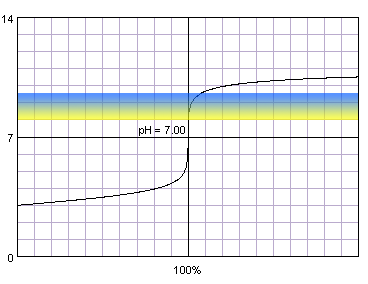
What about other popular indicator, thymol blue?
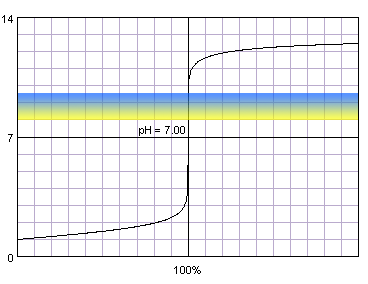
0.1 M strong monoprotic acid titrated with 0.1 M strong monoprotic base in the presence of the thymol blue. Note that while only color change area is marked on the plot, solution is yellow for lower pH and blue for higher pH. Titration curve calculated with BATE - pH calculator.
Even if we are on the other side of the equivalence point, situation is similar - when we start to observe color changes, we are on the steep part of the curve, so small amounts of titrant added dramatically change pH of the solution.
So, from these plots it is obvious that when we stop titration seeing color change, we are close to the equivalence point, however, important question is - how close? Obviously in the first case color stops to change before we have added stoichiometric amount of the titrant, while in the second case we have to add excess of the titrant. That means we may expect a negative error in the first case, and positive error in the second case. How large are these errors?
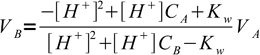
In the acid-base titration curve calculation section we have derived following simple formula, that allows calculation of amount of titrant added for a given solution pH.
 1
1Let's use this formula to calculate volumes of the titrant added to get to pH where methyl red and thymol blue start and end their color changes:
| indicator name | color change start pH | Vb (mL) | color change end pH | Vb (mL) | ΔVb (mL) |
|---|---|---|---|---|---|
| Methyl red | 4.4 | 49.9602 | 6.2 | 49.9994 | 0.0392 |
| Thymol blue | 8.0 | 50.0010 | 9.6 | 50.0398 | 0.0388 |
First pH value - color change starts, second pH value - color change ends. Vb - volume of titrant added to reach pH. ΔVb - difference between first and last color change.
As you can see all values in the table are less than 0.04 mL from the equivalence point (which is at exactly 50 mL). Regardles of whether we will end titration seeing first color change, or whether we will titrate till the end of color change, we will be 0.04 mL from the endpoint in the worst case. 50 mL A class burette has an accuracy of 0.050 mL. These values are comparable, so we can't neglect neither when discussing accuracy of the titration and pH of the end point. However, even if combined, they should not generate error in excess of 0.2%. In many applications that's an acceptable value, so it doesn't matter (much) when exactly we stop titration. Besides, 0.04 mL is a volume comparable with the smallest drop we can add from the burette, so adding one drop of the titrant we can completely change solution color, overshooting the end point.
This reasoning can be generalised. As a rule of thumb you can remember, that for titration of 0.1 M acid with 0.1 M base selection of indicator - as long as it changes color somewhere in the pH 4-10 range - doesn't change substantially accuracy of the determination. There are other, much more important sources of errors.
What will happen if the concentrations of acid and base are much lower?
0.001 M strong monoprotic acid titrated with 0.001 M strong monoprotic base in the presence of the methyl red indicator. Note that while only color change area is marked on the plot, solution is red for lower pH and orange for higher pH. Titration curve calculated with BATE - pH calculator.
As we can see, for methyl red color changes start to be visible long before the steep part of the curve. We have to wait till the very end of color change to not make huge error.
And for thymol blue:
0.001 M strong monoprotic acid titrated with 0.001 M strong monoprotic base in the presence of the thymol blue. Note that while only color change area is marked on the plot, solution is yellow for lower pH and blue for higher pH. Titration curve calculated with BATE - pH calculator.
When the color stops to change, we are well past the steep part of the curve and we have added significant excess of the base to the solution. We should end titration at the very first sign of the color change.
When compared with titration of more concentrated acid solution, situation is not as good now. Obviously when both titrated acid and titrant are less concentrated, pH changes close to the inflection point are much smaller, and first observed color change (in the case of methyl red) or last observed color change (in the case of thymol blue) can be substantially off. Once again let's take a look at the results of volume calculations:
| indicator name | color change start pH | Vb (mL) | color change end pH | Vb (mL) | ΔVb (mL) |
|---|---|---|---|---|---|
| Methyl red | 4.4 | 46.1714 | 6.2 | 49.9385 | 3.7672 |
| Thymol blue | 8.0 | 50.0991 | 9.6 | 54.1461 | 4.0470 |
First pH value - color change starts, second pH value - color change ends. Vb - volume of titrant added to reach pH. ΔVb - difference between first and last color change.
This time volumes of titrant that have to be added to completely change solution color are in the range of 8% of the stoichiometric volume. We can't titrate to any color change - to be reasonably accurate we should titrate very precisely to the end of color change of methyl red or to the first visible color change of thymol blue. That's not always easy and possible, that's why titration of diluted acids is much more difficult.
Discussion above was valid for two color indicators, however, there are also indicators that have only one color - like phenolphthalein.
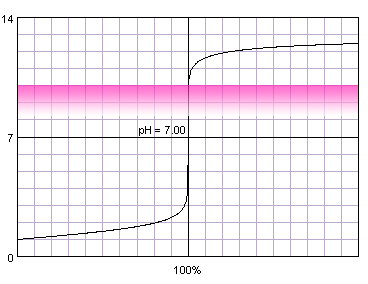
0.1 M strong monoprotic acid titrated with 0.1 M strong monoprotic base in the presence of the phenolphthalein. Note that while only color change area is marked on the plot, solution is colorless for lower pH and pink for higher pH. Titration curve calculated with BATE - pH calculator.
Phenolphthalein starts to be visible at pH about 8.2 and changes color completely at pH about 9.8.
| concentration | color change start pH | Vb (mL) | color change end pH | Vb (mL) | ΔVb (mL) |
|---|---|---|---|---|---|
| 0.1 M | 8.2 | 50.0016 | 9.8 | 50.0631 | 0.0616 |
| 0.001 M | 8.2 | 50.1581 | 9.8 | 56.7354 | 6.5764 |
Concentration is assumed to be identical for both acid and base. First pH value - color change starts, second pH value - color change ends. Vb - volume of titrant added to reach pH. ΔVb - difference between first and last color change.
As we can see in the table, in the case of concentrated solution it doesn't matter much whether we titrate till we start to see phenolphthalein, or till the color change is complete - in both cases we are very close to the equivalence point. That's nothing strange - phenolphthalein fits our rule of thumb that any indicator changing color between pH 4 and 10 will do in the case of not too diluted strong acid. In the case of the diluted acid complete color change is way too far from the equivalence point. Depending on the accuracy needed even the first color change can be occuring a little bit too late.
While appearance of the color in the previously colorless solution is often easier to spot than slight color change, moment at which we can spot color appearance depends on the indicator concentration. Tenfold increase in the phenolphthalein concentration means that its color will be visible at 1 pH unit lower concentration. Adding tenfold excess is a huge error, but adding two drops of the indicator instead of one is much more probably and means twofold concentration increase. That in turn translates into 0.3 pH unit difference.
It may seem that we could try to increase phenolphthalein concentration to lower pH at which it starts to be visible, however, phenolphthalein is very weakly soluble in water.
Above discussion, although mainly based on acid base titration, is to a large extent valid for every kind of titration. The more diluted titrated substance and/or titrant, the shorter the steep part of the titration curve and the more precise determination of the end point is required. The more concentrated the single color indicator, the earlier its color becomes visible (or later disappear).
There exist an approximated, but relatively simple and universal method of end point indicator selection, that works regardless of the titration type. It is based on the assumption that end point detection should be in the ±0.1% range of the equivalence point. Calculate titration parameter (be it pH, pMe or redox potential) for 99.9% and 100.1% titration percentage, and select indicator that changes color between these two values.