Acid base titration - end point indicators preparation
Different indicators require different methods of preparation. In the following table we have collected some basic information about indicators and their solutions. See more complete list of pH indicators at www.ph-meter.info (note that this list doesn't contain information about solution preparation).
| indicator name | pH color | pH color | prepared as |
|---|---|---|---|
| Methyl violet | 0.1 yellow | 2.7 violet | 0.05% water |
| Cresol red | 0.2 red | 1.8 yellow | 0.1% water |
| Thymol blue | 1.2 red | 2.8 yellow | 0.05% water |
| 2,4-Dinitro phenol | 2.8 colourless | 4.7 yellow | 0.1% ethanol |
| Congo red | 3.0 blue | 5.2 yellow/orange | 0.1% water |
| Methyl orange | 3.1 red | 4.4 yellow/orange | 0.1% water |
| Bromocresol green | 3.8 yellow | 5.4 blue | 0.1% water |
| Methyl red | 4.4 red | 6.2 yellow/orange | 0.1% ethanol |
| Chlorophenol red | 4.8 yellow | 6.4 purple | 0.1g in 24 mL of 0.01 M NaOH, dilute to 250 mL |
| Litmus | 5.0 red | 8.0 blue | 0.5% water |
| Bromocresol purple | 5.2 yellow | 6.8 purple | 0.05% water |
| Bromothymol blue | 6.0 yellow | 7.6 blue | 0.05% water |
| Phenol red | 6.4 yellow | 8.2 red/violet | 0.05% water |
| Neutral red | 6.8 red | 8.0 orange | 0.01% in 50% v/v ethanol |
| Creosol red | 7.0 orange | 8.8 purple | 0.1% water |
| Thymol blue | 8.0 yellow | 9.6 blue | 0.05% water |
| Phenolphthalein | 8.2 colourless | 9.8 red/violet | 0.5% ethanol |
| Thymolphthalein | 9.3 colourless | 10.5 blue | 0.2% ethanol |
| Alizarin yellow GG | 10.0 bright yellow | 12.1 brown/yellow | 0.1% ethanol |
Please note, that different sources list different methods for indicator preparation. For example for 2,4-dinitro phenol some sources propose to prepare 0.1% ethanol solution, while other suggest using just a saturated water solution.
Colors of some of the indicators listed in the table above:
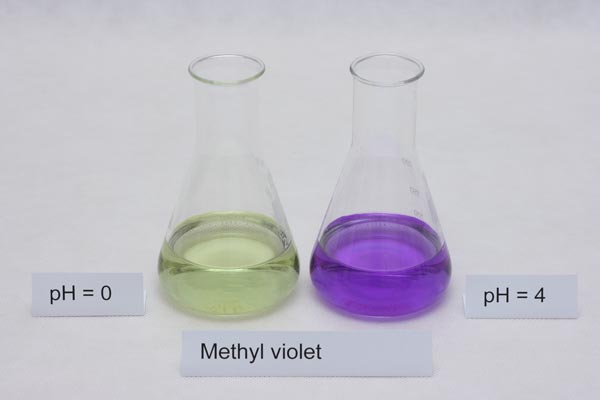
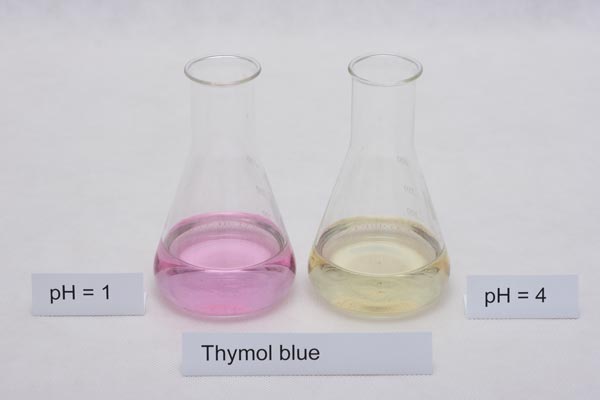
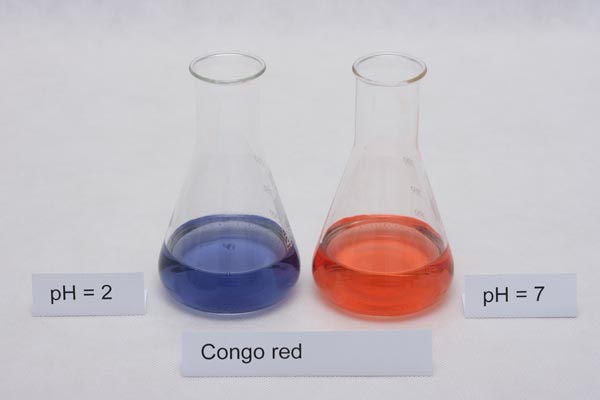
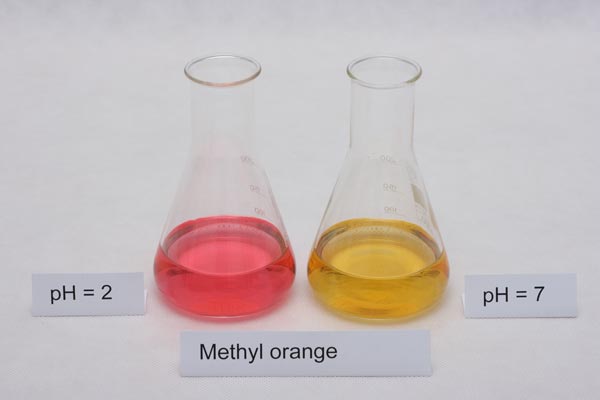
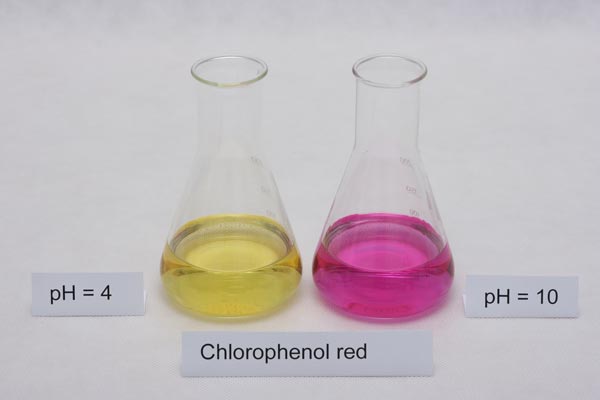
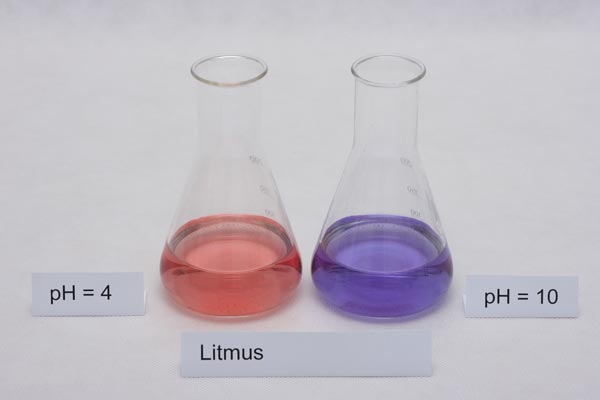
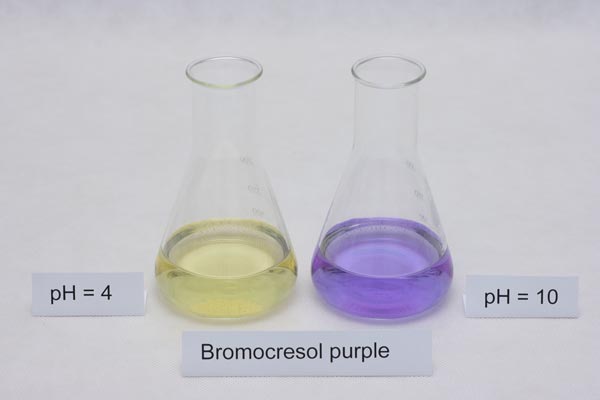
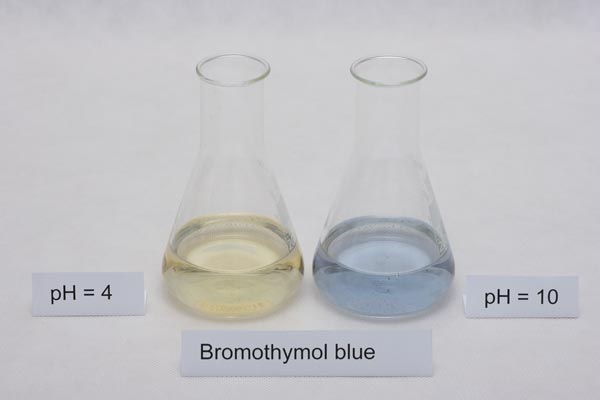
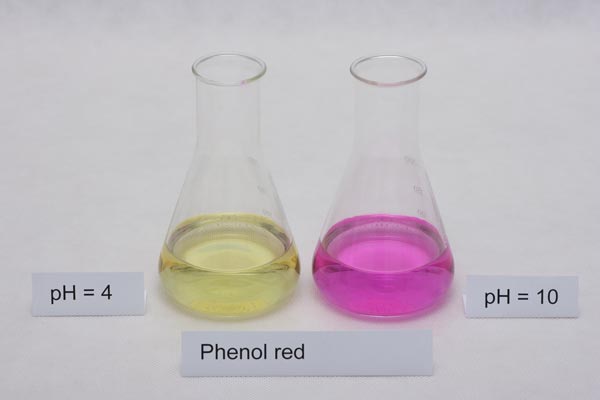
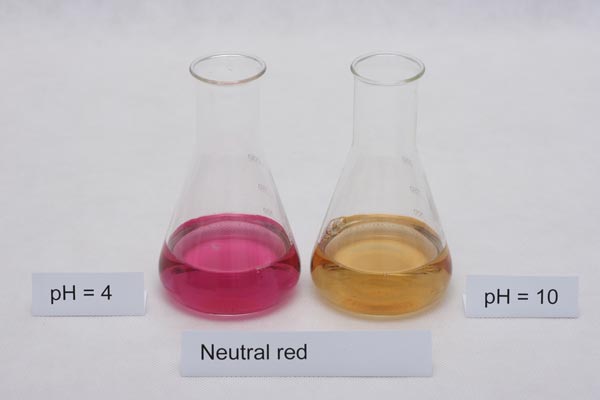
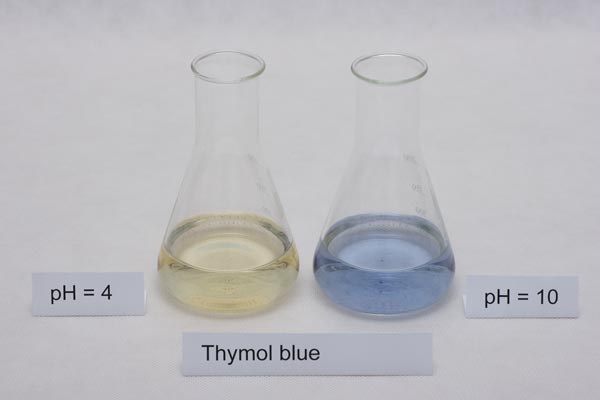
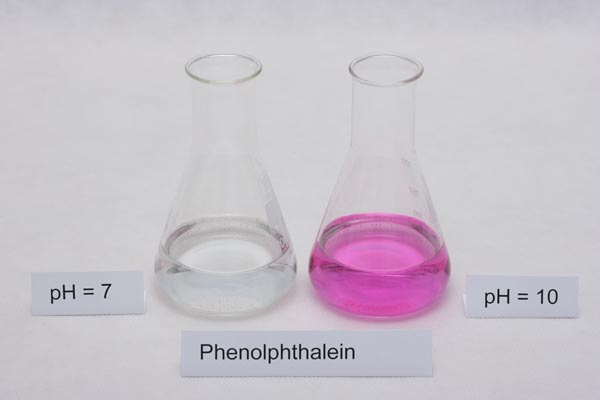
Colors on the pictures can slightly differ from reality, as hues displayed depend on the monitor calibration. pH values listed on the pictures refer to the actual pH of the solution as prepared, not the pH at which indicator changes color. In lab reality colors will be less saturated, as to be sure colors are well visible we used an excess of indicators.
See also detailed discussion on the pH indicators equilibria and color changes.


