Definitions of titrant, titration curve, end point and equivalence point
There are many different types of titrations that differ by the titrant used and substances that can be determined. While every titration is different, they all share similar characteristics - but before we start to discuss them, let's define several important terms:
titrant
The titrant is a substance added from the burette. The titrant used and the reaction that proceeds usually define name of the titration - like acid-base (or alkalimetric) titration if we use strong acid (or strong base) as a titrant, or redox when the reaction that proceeds is of a redox type. Name can be also much more specific - like permanganometric titration (also known as manganometry or permanganometry) when titrant is potassium permanganate.
titration fraction (or titration percentage)
The titration fraction tells us how far we have proceeded with the titration. At the equivalence point we have added a stoichiometric amount of titrant so the titration fraction will equal 1 (or 100%, when it is expressed as titration percentage).
It may seem that convenient to use titrant volume to measure the titration progress, but that's not the case. For example, it is much easier to say "a pH at 50% titration equals the pKa of a monoprotic weak acid" then to calculate each time the volume of titrant added to get to the same point.
Note that in the case of polyprotic acids, 100% titration may either mean that only the first proton was fully neutralized, or that acid was completely neutralized. Thus, depending on the definition used fully titrated phosphoric acid is titrated either at 100% or 300%. We will use the latter number throughout the site.
titration equivalence point
The equivalence point is where the titration should really end - the titration fraction equals exactly 1, so we have added the stoichiometric amount of titrant to titrated substance. However, this is not necessarily where we end titration.
titration end point
The end point is where the titration ends in practice. The closer the end point to the equivalence point the better, but it is often not easy to find a good method of equivalence point detection. However, very often we can easily spot a point very close to the equivalence point - and that's where the end point will be.
For example, in alkalimetric titration of a strong acid with a strong base, the equivalence point is at pH 7.00, but the most popular and convenient indicator used - phenolphthalein - starts to change color at pH slightly above 8 (in the lab practice change can be observed much closer to 9). In permanganate titrations we don't use any special indicator, as the permanganate solution is strongly colored and excess of titrant added is easily visible (especially if we put white paper sheet behind the flask). In both cases we can't see the color without adding small excess of titrant which introduces small positive error in the titration As long as this error is in the same range as the burette precision (and precision with which we can read the volume) we can safely ignore it.
titration curve
The titration curve is a plot of changes of a selected property of a solution during titration. The property selection depends on the titration: In the case of alkalimetric titration we look for the changes in solution pH. In the case of complexometric titration, we usually trace changes in metal concentration (using its logarithm or minus logarithm on the plot, as concentration can change even 1010 times). During redox titrations we look for the redox potential in the solution and so on.
Most titration curves have the same shape: a plateau in the first part, and a sharp rise (or fall) near equivalence point (inflection point of the curve), which is followed by a second flat part. The most important part of the curve is the one where the changes are the fastest - close to the inflection point. Thanks to the fact that changes occur so fast there, and are so large, they are usually easily detectable. That in turn helps us detect the titration end point.
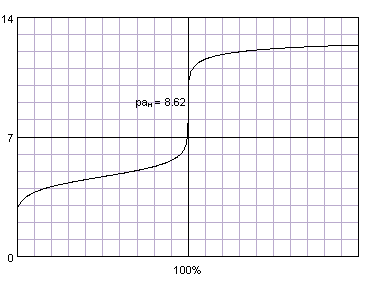
Acetic acid titrated with sodium hydroxide. Titration curve generated with BATE - pH calculator.
Sometimes (depending on the titration type and solution property selected) the titration curve can have a different shape. For example, if we use conductometry to locate the end point of alkalimetric titration, we measure not the solution pH, but its conductance. Titration curves are in this case V shaped.